Can any Practical Punting Monthly readers remember back to the 'dark' days before 1985, when there wasn't such a magazine as this? Doesn't bear thinking about, does it?
In those bygone days, punters did have access to some information, albeit it pales by comparison with what's available today, not only through the pages of Practical Punting Monthly, but from varied sources as the Internet, by fax and by some of the excellent subscription services such as Clock Speed.
However, I do remember one of the racing magazines at the time publishing a list of average times for metropolitan tracks, which included the times for the various track conditions. This enabled comparisons to be made between a horse that won at 1200m at one track with another that won at 1200rn on a different track and one that may have won on a good track with one that won on a dead or slow track. The combinations of different tracks and track conditions are seemingly endless.
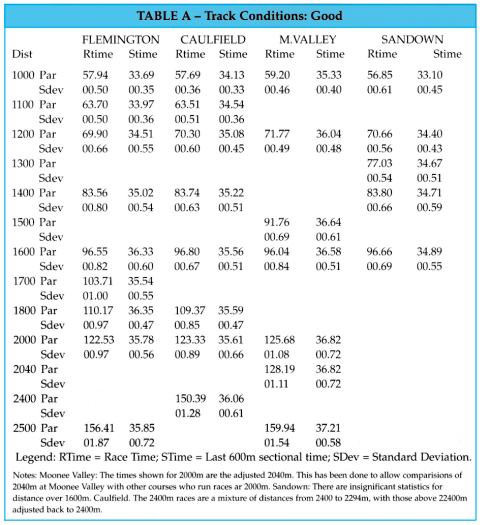
I shall ask you a question about times. Which is the best of the performances? A winner over 1200m at Caulfield, in a time of 70.30s, or a winner over the same distance at Sandown in a time of 70.88s, or one at Moonee Valley in a time of 71.77s?
What about comparing the times over the same distance at the same track, but in different track conditions? How does a time of 98.04s on a good track at Moonee Vallev for 1600m compare with one on a slow track in a time of 100.92s over the same distance at the same venue?
In fact, in all the examples above, the times are exactly comparable, not one time is better than another, with all of them being the 'par' times for the respective tracks, conditions and distances.
The tables published as part of this article are the first such tables available to the general public I have seen, giving details of the 'par' times at all popular distances at the metropolitan tracks in Melbourne. Now, by using these up-to-date tables as a reference point, the reader can, for the first time in many years, compare the performances of horses competing at different tracks and in varying track conditions.
What are 'par' times, you may be asking yourself, and how are they calculated? Using only statistical records going back to 1996, all overall and final sectional times (i.e. last 600m as published in the formguides) have been recorded and then the top and bottom 10 per cent times are removed before averaging to determine the final par times. They are, in effect, smoothed average times: smoothed because they have had the extremes of the range excluded before the average times are determined.
As well, for the first time in my knowledge, in this article 'par' times ire included for the final 600m sectionals, and standard deviations for both the race and sectional times. Standard deviations are a fraction either side of the par time, which is allowable but still makes the par time valid.
For example, the par time for 1200m races on good track conditions at Caulfield is 70.3 seconds. With a standard deviation of 0.6 second, this means that any time within the range 69.7 to 70.9 is considered normal.
If the time was outside this range, there is a need for further investigation into why this has occurred. Was the track on 'fire' with exceptionally fast times, perhaps fuelled by strong winds?
Had there been rain during the meeting and although the track had still been officially rated as good it may have actually deteriorated to dead, as would now be shown by the times being outside the standard deviation range.
But, a word of caution: on the majority of occasions, as high as 80 per cent, in truly run races, the winners will run within the expected par time range, as indicated by the standard deviation. Any times slower than par and outside the range, will be either as a result of the race not being truly run, or the race being of low quality.
Normally it is races longer than 1400m that are not truly run, or in races with a small number of runners. It is in these types of races that there is more likelihood of the race times being outside the standard deviation.
However, every so often a group of exceptional horses, possibly only one, contests a race that produces fast times outside the standard deviation. If you can't find any reasons for these fast times, believe 'em, they stand as they are.
In stating the above, it should also be taken into account that times recorded on track conditions that are lightning fast are of little real value to punters At Moonee Valley on Cox Plate day in 1998, 17 horses broke the prevailing track records, with every horse bar one doing so in the Cox Plate.
Such occurrences lead to distortions in the use of times as a handicapping tool. The manner in which my par times have been established removes these distortions.
Table A lists the pars for both the race and sectional times, as well as the standard deviations for the four Melbourne metropolitan tracks, for races run in good track conditions.

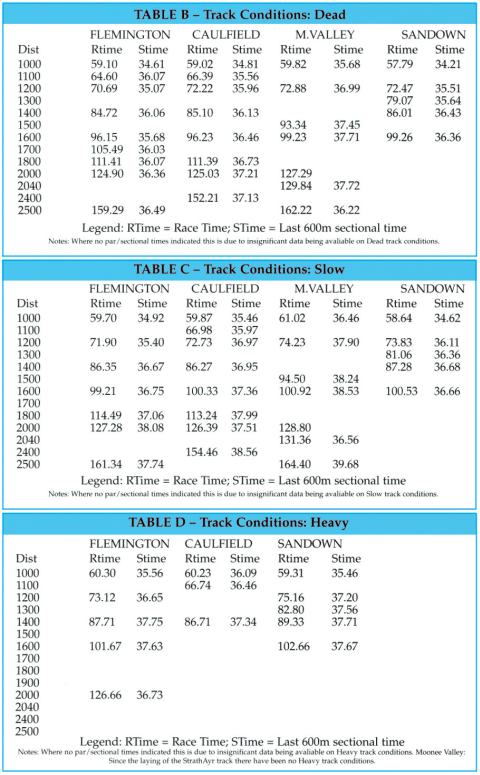
Tables B, C and D list the race and sectional times for the same venues on dead, slow and heavy tracks. With these tables, due to insufficient data, there are instances of times being omitted.

One of the finest Australian books on horse-race analysis and handicapping was published many years ago, originally in the late 1960s and republished in the mid '70s, written by Rem Plante and titled the Australian Horse Racing and Punter's Guide.
It was the first book I ever bought on horse-race handicapping, and it is still treasured today, as it was those many years ago. However, the author, while making some pertinent points regarding the use of times in horse-racing, also stated in the book that he regarded "time ratings as unrealistic and highly unreliable" (p249).
He wasn't the first and certainly not the last to make similar remarks. In his first best-selling book, Winning, the late Don Scott wrote that he considered "times, final and sectional, unimportant, downright misleading and false" (p9l) and he provided several reasons to justify his opinion.
Even today, there are some non believers, although I suspect their numbers are dwindling with the passing of time and the amount of times-based information available today, with publications such as Tony Brassel's excellent Clock Speed, and the information supplied by Equitime, which provides sectional times for every 200m of each race, for all runners at Melbourne metropolitan meetings, Such publications would not survive and prosper if the demand wasn't there.
Plante and Scott, while giving some valid reasons for their opinions on the use of times in racing, were too narrow in their thinking on this issue. Race and sectional times are pieces of information in the overall jigsaw puzzle that is race analysis handicapping and it is the interpretation of such information that provides the knowledge to better analyse both what has happened in races under review, and what may occur in the future.
The study and use of race and sectional times are valuable tools in race analysis. Research carried out in the '90s in the UK disclosed that horses that had run faster than the average time won 43 per cent of the time, returning a profit on turnover of 35 per cent.
Many years ago there was a 20/1 winner named Embarrassed who won the opening race at the Aqueduct track in the US. A jubilant lady in the payout queue explained to anyone within earshot that she had been terribly embarrassed that morning when the shoulder strap of her slip had broken, causing the slip to land in a heap around her feet. Shortly after, when looking at the racing paper she saw that a horse named Embarrassed was running that day she knew she was on a winner.
However, there was a guy in the same payout queue who took his form study a little more seriously. He was heard to quip, "She's some handicapper", going on to add that he backed the same horse because, "It was the only horse in the race that ever did three-quarters of a mile in less than 1.10."
Worth a thought or two, isn't it?
By E.J. Minnis
PRACTICAL PUNTING - MARCH 2000