In this article, our senior contributor E. J. Minnis replies to queries sent in by PPM readers.
Paul Guidara is a Melbourne based reader of Practical Punting Monthly and a very keen form student who devotes a lot of his time to pace and speed ratings.
I have corresponded with Paul on numerous occasions and lie asks the following:
A few years ago you published an article for PPM in regards to running styles and the percentage of winners as they approached the 400m - can you update these statistics?
It was actually back in the December 1997 edition of the magazine that those statistics were published. At the time, the statistics were based on a mere 2247 races and, more than five years later, a revision is well overdue.
This time around, however, the numbers used are far more substantial, amounting to some 420,252 horse runs in 38,942 races, an average of 10.8 runners per race.
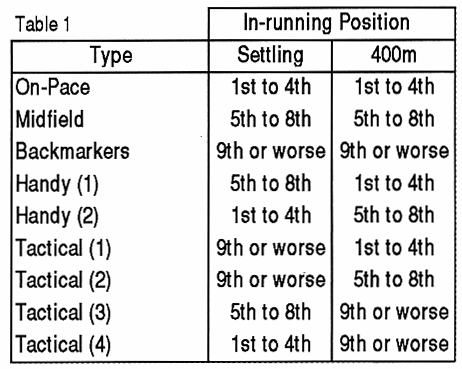
The statistics were broken up into nine separate categories (Table 1).

Note:
On-Pace runners are those considered in the first four; Mid field runners are those consideredrunning 5th to 8th; and Backmarkers are those considered running 9th or worse.
In the original analysis, on-pace winners accounted for 50.3 per cent of all winners, while midfield runners accounted for another 19 per cent.
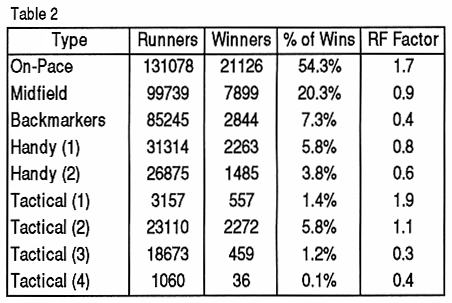
This time around, the analysis once again proves just how strong a form factor out-pace runners are, as they now account for 54.3 per cent of
winners, while midfielders account for another 20.3 per cent, a total of 74.6 per cent.
In fact, further analysis reveals that 61.5 per cent of all winners are positioned 1st to 4th at the 400m, while a mere 8.6 per cent of winners are placed 9th or worse - compelling statistics. Who amongst you can honestly state that they bet backmarkers with any confidence?
There is clear evidence that punters face a dilemma when considering backmarkers as a betting proposition, with the all-the-way on-pacers having a very positive RF Factor of 1.7, the midfielders an RF of 0.9 (very much a neutral situation) but the backmarkers' RF of 0.4 causes real concern (Table 2).

Note* The RF Factor is the Relevant Frequency Factor, which m ems that a factor of one or higher is a positive, while a factor of below one is a negative.
One of the more interesting observations is with horses settling 9th or worse: they have the ability to move forward and be positioned closer to the pace by the 400m, and both categories (Tactical 1 and Tactical 2) have positive RF factors.
Settling backmarkers able to be positioned in the first four at the 400m have the best RF Factor of any category, albeit they also represent a far smaller group of runners, the assumption being that such runners have the ability to accelerate - often the mark of a good horse.
A further analysis of the on-pacers also reveals that 15.2 per cent of all winners led all the way, with a total of 29.6 per cent of winners positioned either first or second throughout (Table 3).

Note: Percentages in brackets are hose of he previous analysis.
Okay, I can hear people saying, the above analysis is skewed as not all races have an equal distribution of on-pace, midfield and backmarker runners, which is correct.
It is only in races of 12 or more runners, where those positioned 9th or worse would at least be equal in numbers to those considered to be on-pace or midfield runners.
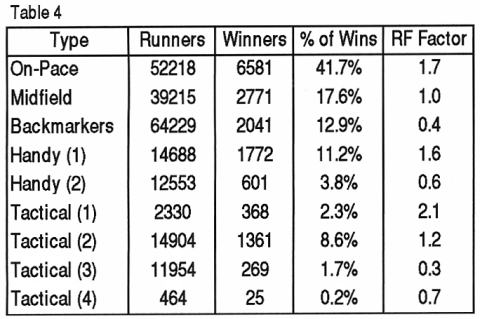
A further analysis of races with 12 or more starters discloses the following distribution of runners to winners (Table 4).

In fields of 12 or more, there were a total of 212,555 runners in 15,789 races for an average of 13.5 runners per race.
Not surprisingly, the backmarkers do have a better strike rate, rising from 7.3 per cent to 12.9 per cent, and as a result the winning strike rates of both the on-pacers and the midfielders drops from a combined total of 74.6 per cent to 59.3 per cent.
However, this is somewhat counterbalanced by the fact that the RF factors remain very much the same as the overall statistics - which remain remarkably stable.
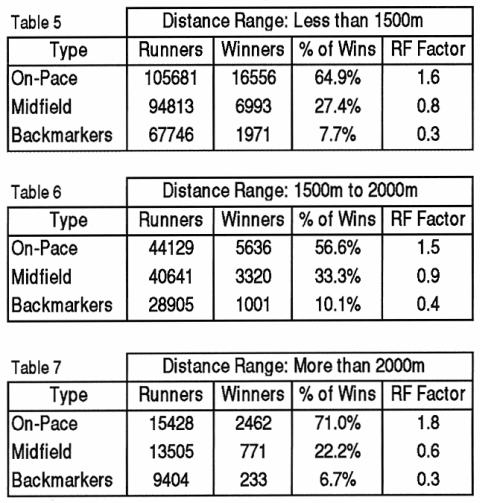
Taking the analysis a little further, we now look at the distribution of runners to winners over the various distance ranges, which have been broken up into three categories: sprints (less than 1500m), middle-distance (1500m to 2000m) and distance races (more than 2000m).
Once again there is a level of stability in the statistics compared to the overall analysis, with the on-pacers again dominating the strike rates.
In particular, at 2000m or longer, the on-pacers win over 70 per cent of races, while backmarkers really struggle, managing to win a mere 6.7 per cent.
Only the in-running positions at the 400m have been used in Tables 5, 6 and 7.

To complete Paul's query, an analysis follows of the in-running positions and the varying track conditions (fast/good, dead, slow and heavy). Like the previous analysis on distance ranges, Tables 8, 9, 10 and 11 have been restricted to the in-running positions at the 400m.
The stability of both the strike rates and the RF factors for each of the categories can only be interpreted as indicating that irrespective of the number of starters in a race, the distance of the race or the track conditions, on-pacers have at least four times more chance of winning than backmarkers!

Back in 1997, I stated, this is a clear indication of where the astute punter should look when doing his or her form analysis".
If that was true six years ago, it is even more so today in 2003 - leaders and on-pacers keep winning, while backmarkers find it a never-ending struggle.
By E.J. Minnis
PRACTICAL PUNTING - MAY 2003