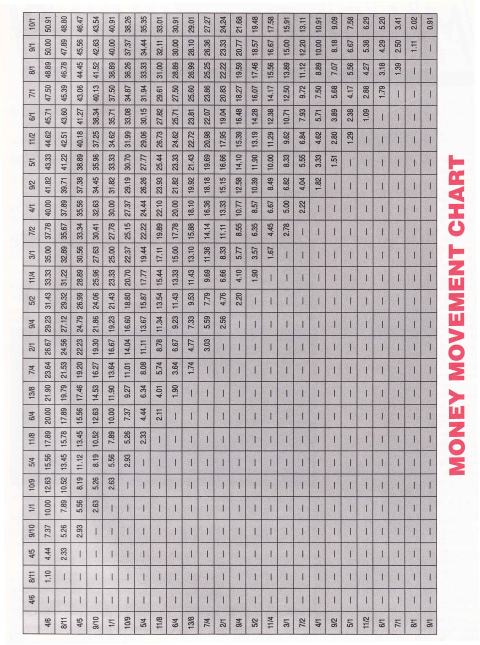
I conducted a recent test among my friends, all keen amateur punters who prided themselves on having an intimate knowledge of racing and betting. I asked them the simple question: What percentage of a 100 per cent market is a 13/8 chance? I gave them a minute to think about it. Only one of the four friends could come up with the answer of 38.10 per cent.
I believe punters, if they are serious about winning, should know all the percentages off by heart, and if they don't they should learn them, much like they learned their multiplication tables at school.
And now we get down to the nitty-gritty of this article. You want to increase your knowledge, of course, and by reading this article you are progressing. Having a grasp of the probabilities of betting means that you can move on and take advantage of it.
I suggest you start to follow the money, and this is done by studying the price moves at the race track or on the TV monitor in your agency. You want to track the shorteners in the market, those horses which open at a certain price and then firm in the betting.
But often there are several horses which firm. Which ones should you concentrate on? Using the percentage figures, you can give yourself a very clear idea of which betting moves have the most impact, in percentage terms. In other words, four horses may firm in the betting and yet one of them may stand out in percentage terms as being the most important firmer.
What you need to know when you're looking at the firmers is which ones are the biggest firmers? You should follow the actual percentage move-and that's where the attached chart comes in. I've drawn this up so you can tell at a glance what each betting 'firming' means in percentage terms.
The chart covers prices from 10/1 down to 4/6, which is the range most punters will be interested in as far as 'firmers' are concerned. So, OK, let's look at an example: You see that three horses have firmed in the betting. Horse A has gone from 13/8 into even money. Horse B from 9/2 into 4/1 and Horse C from 10/1 into 7/1. All a bit confusing, eh?
Not so confusing, though, when you use the chart. This explains it all very clearly. The prices across the top are the ones at which the horse opened ' the prices on the left are the ones to which the horse firmed.
Merely run your finger down from the top price and then match the figure that corresponds from the left column and you will be able to see how many percentage points a horse has actually firmed.
In the example I have just given, we will see that Horse A, in going from 13/8 into evens, has firmed a total of 11.90 per cent. Horse B, in firming from 9/2 into 4/1, has strengthened by 1.82 per cent, and Horse C, in firming from 10/1 into 7/1, has strengthened by 3.41 per cent.
Clearly then, the most significant move has been for Horse A in firming almost 12 percentage points. Horse C is the next most important firmer in the market.
By following the chart and noting these percentage moves, you can retain a sane idea of exactly what is going on. For instance, sometims we see stories saying that a certain horse was a 'big firmer' in the market, going from say 9/1 into 6/1. In fact, the price has shifted only 4.29 per cent.
A horse going from 4/5 to 4/6 firms the same amount approximately (refer to the chart and note the figure 4.44). The big percentage firmers come in the lower prices, where a horse opening at say, 512 and firming into 10/9 has actually strengthened by 21.43 per cent.
Let's look at a real example, the Lumley Handicap at Samdown, where only two horses under 10/1 were firmers in the market. The first was Mardisi, in from 4s into 5/2, the second was Taffeta Bow, hi from 6s to 11/1. By referring to the chart we see that Mardisi's price has strengthened by 8.57 per cent against a 1.09 per cent firm for Taffeta Bow. Mardisi was the obvious tip and she won the race.
You will find numerous examples of how the 'strong' firmer won. This aspect of betting - following the shorteners - is vitally important because so many races these days are won by horses which firm in the betting. Look through any set of results and all will be dearly revealed to you.
Punters who ignore the firmers do so at their own peril. Wouldn't you fed happier having your money riding on a well-backed horse than on a horse which has opened at 3s and blown to 8s? Of course, you would.
Sometimes, the actual percentages firming will be dose. You might have a horse firming from Ss into 9/2 and a second horse firming from 6/1 into 511, percentage gains of 1-51 and 2.38. There is then, less than a percentage point between the firms. In cases like this, it would be worth backing both horses, something easily done at odds of 9/2 and 5/1.
I suggest you photocopy the chart and take it with you to the races. It will be invaluable if you become a student on prices and are on constant lookout for those horses coming in on the betting boards under the weight of money out an them.
The chart will help you to take fullest advantage of the price moves and to know exactly what is going an m percentage terms.
The chart of course, also enables you to check price 'easers' - just follow the prices from left to right.

By Statsman
PRACTICAL PUNTING - MAY 1990